How the coronavirus pandemic slashed carbon emissions — in five graphs
Compared to last year, China's carbon emissions through March were roughly 10% lower in 2020.
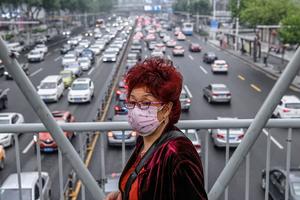
The international response to the coronavirus pandemic has so far slashed global carbon emissions by more than 8%, according to detailed estimates from a pair of independent research teams. That’s roughly three times the annual emissions of Italy. But energy consumption is already rebounding in China and elsewhere, and the pandemic could register as little more than a blip in the climate system as government-imposed lockdowns come to an end.
Most reporting on carbon emissions takes place annually, but the unprecedented social and economic shock brought about by the pandemic has spurred interest in tracking energy and emissions trends in real time. Pulling information from a variety of sources — including energy and weather reports, satellite-based observations and traffic data collected by vehicle-navigation systems in more than 400 cities around the world — two international teams have now provided the first estimates of how carbon emissions are changing daily across the globe.
Although they differ in certain details, the analyses come to similar conclusions: carbon emissions fell by more than one billion tonnes in the first four months of the year compared with the same period in 2019.
“The question was in the air,” says Corinne Le Quéré, a climate scientist at the University of East Anglia in Norwich, UK, and lead author of one study, published on 19 May in Nature Climate Change1. “We developed two different methods, so it’s quite encouraging to see that our results are comparable.”
Le Quéré’s team compiled information on daily emissions from different sectors in a variety of cities, regions and countries, and then analysed the measures taken by governments to control the spread of coronavirus.
On the basis that these measures will be relaxed over the course of this year, the team projected that the cumulative global emissions for 2020 could drop by anything from 4–7%, which would represent the largest drop since the Second World War (see ‘A V-shaped recovery’). “We’ve never seen anything like this,” Le Quéré says.
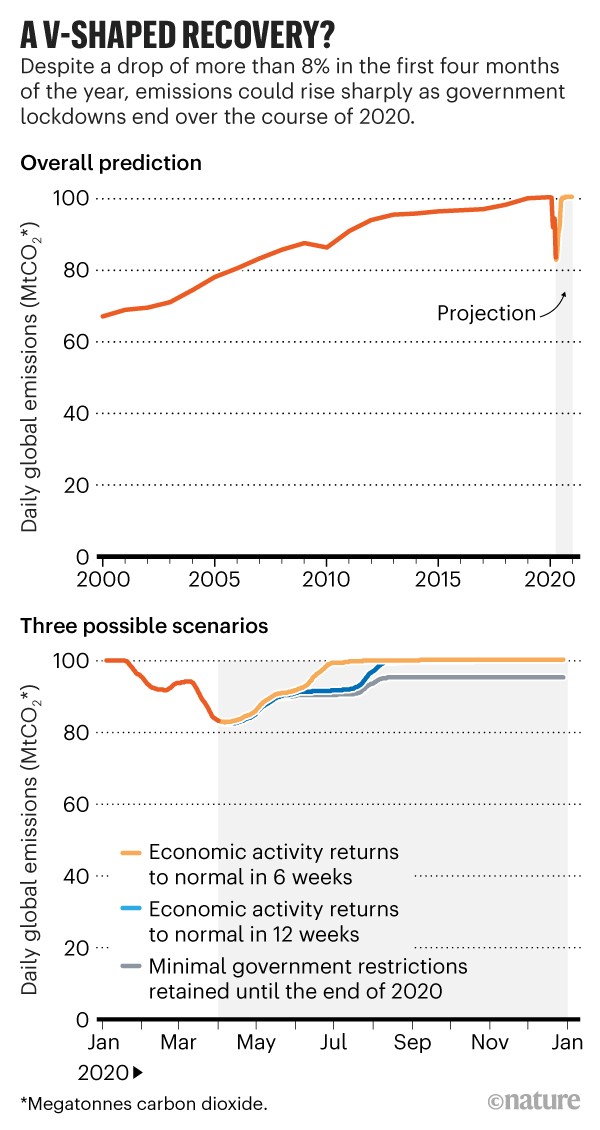
Source: ref. 1
In fact, the scale of the reduction in emissions this year could be similar to the annual emissions reductions that would be required in order to meet the objectives of the 2015 Paris climate agreement, which seeks to limit global warming to 1.5 to 2°C above preindustrial levels. If the 2008 economic recession is any guide, however, emissions could recover quickly.
The question is whether societies will change, and whether governments will advance a low-carbon energy agenda as they seek to stimulate the economy, says Philippe Ciais, a carbon-cycle researcher at the Laboratory of Climate and Environmental Sciences in Gif-sur-Yvette, France, who is leading a second effort to monitor global emissions in near-real time. “With this kind of data, we hope to look for answers.”
Ciais’s team is building a prototype monitoring system that operates on timescales of days to weeks2. They analysed energy data from more than 400 cities and 130 countries as well as weather data across the globe to produce daily estimates of carbon emissions for 2019 and 2020. According to their preliminary estimates, global emissions started to significantly diverge from last year’s in March, as countries around the world began shutting down businesses and enforcing social-distancing measures (see ‘Daily comparisons’).
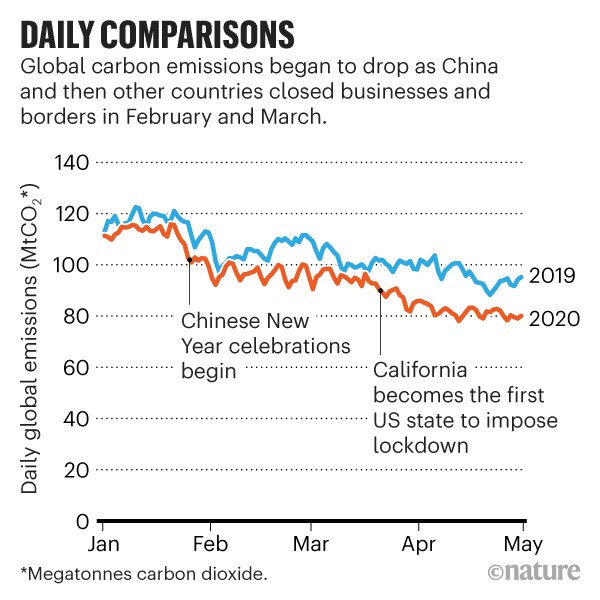
Source: ref. 2
China, unsurprisingly, led the decline (see ‘China leads’). Figures from the world’s largest producer of greenhouse gases started to fall sharply in January, but much of that decline coincided with an annual reduction in energy consumption at the start of the Chinese New Year. Lockdowns in China helped to maintain lower emission levels in the country, accounting for a 10% reduction until the end of March compared with last year. As economic activity picked up in China, other countries went into lockdown mode, depressing global emissions throughout April.
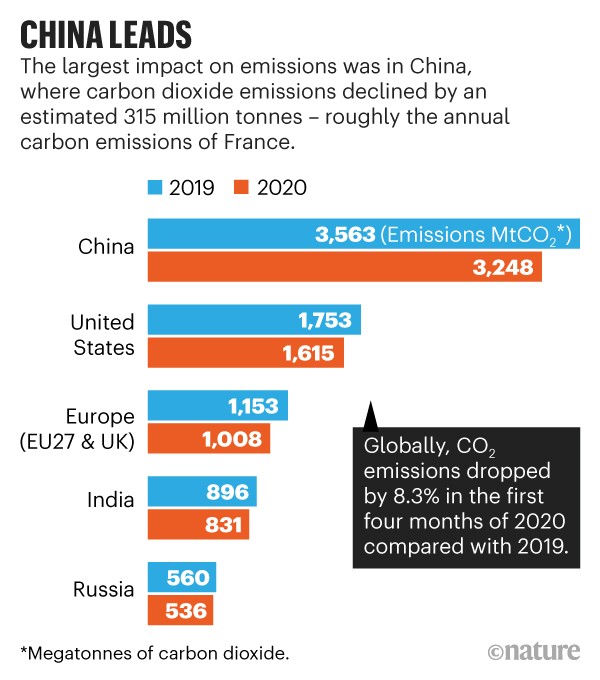
Source: ref. 2
The aviation industry experienced the a dramatic decline, with emissions falling by more than 21% in the first four months of the year, but the largest emission reductions in absolute numbers were in the electric power and ground transport sectors (see ‘Roads and power’).
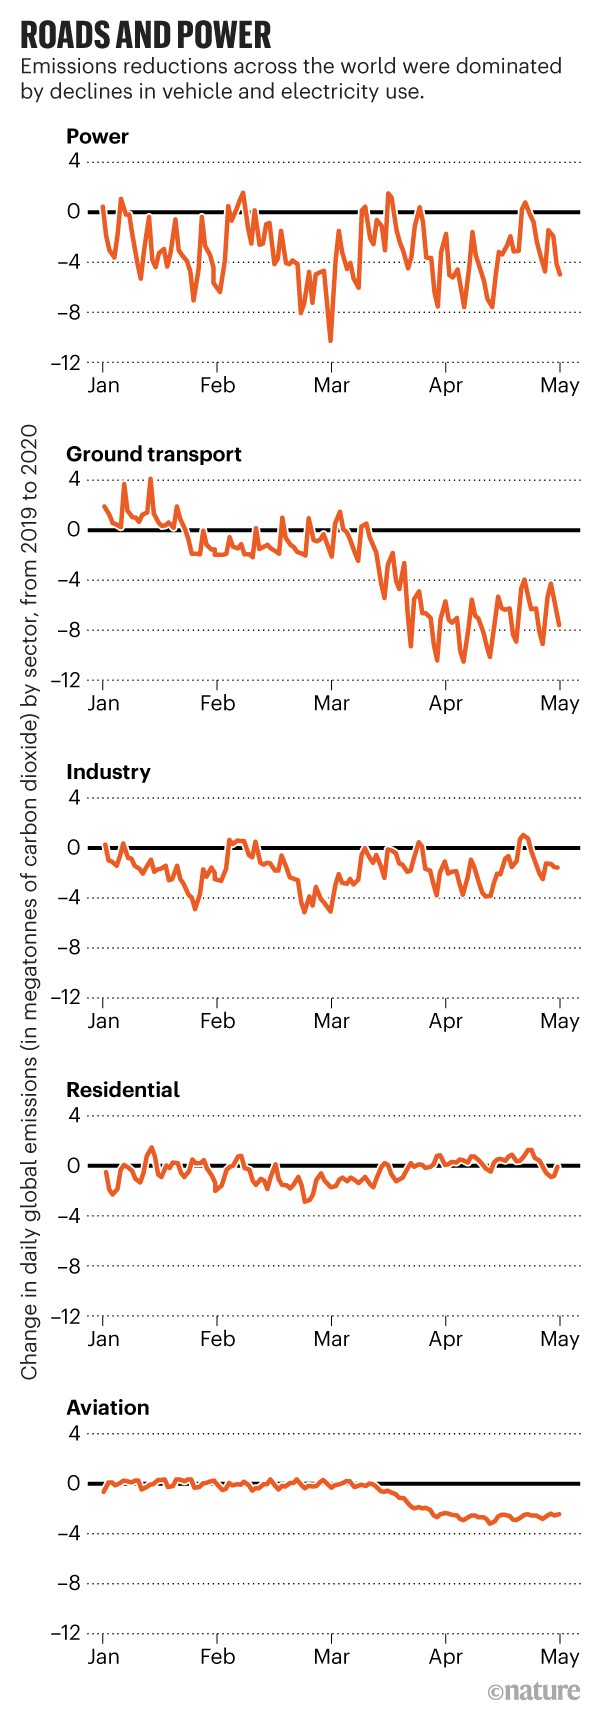
Source: ref. 2
Commercial and industrial demand for electricity dropped off as businesses closed down, and people all over the world parked their cars and stayed at home (see ‘Divergent paths’). “That’s one of the things that stands out: people still drove during the 2008 economic recession, but they are not driving now,” says collaborator Steven Davis, an earth-system scientist at the University of California Irvine. The data and methodologies developed by Ciais and his team have yet to be published in a peer-reviewed journal.
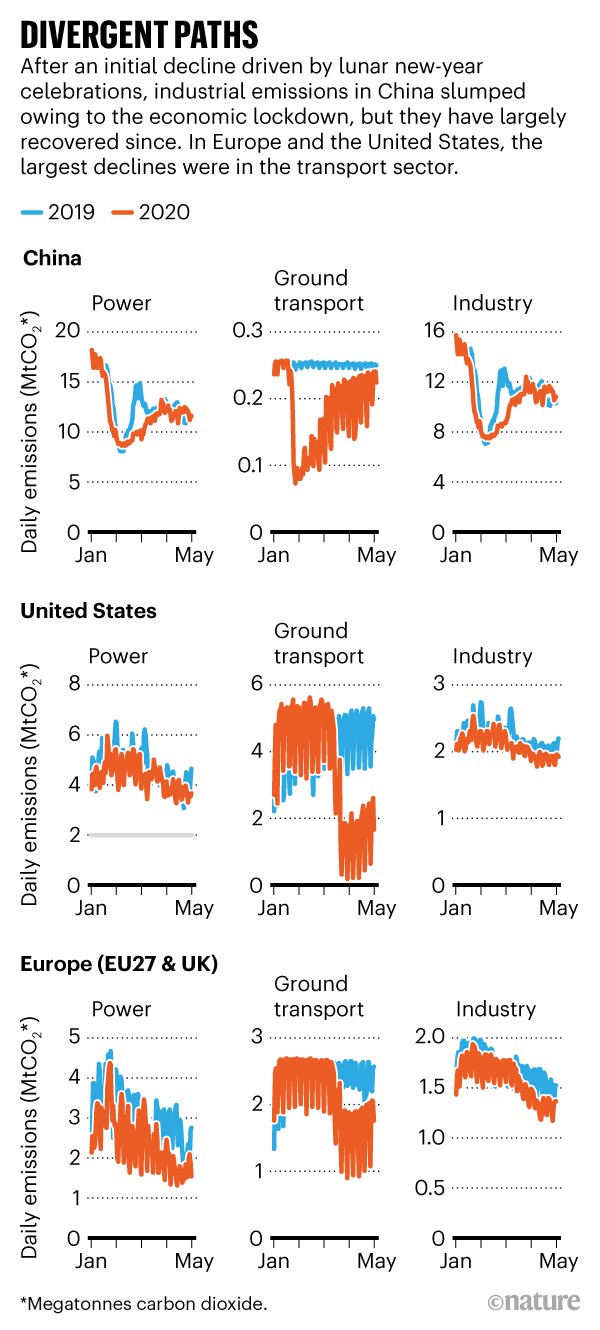
Source: ref. 2
Such work could help to fill a yawning gap in emissions monitoring. “This has enormous potential,” says Bill Hare, who heads Climate Analytics, a non-profit consultancy in Berlin. Monitoring emissions in near-real time will ultimately be required as countries move to curb emissions in the future, Hare says, and that probably means developing energy-tracking systems as well as satellite systems that can provide a detailed view of how energy consumption, and thus emissions, change in response to climate policies.
doi: 10.1038/d41586-020-01497-0
References
- Le Quéré, C. et al. Nature Clim. Change https://doi.org/10.1038/s41558-020-0797-x (2020).
- Liu, Z. et al. Preprint at https://arxiv.org/abs/2004.13614 (2020).