Atmospheric Composition and Chemistry:
We study the composition and chemistry of the earth's atmosphere through active research programs in diverse global settings.
- Global Trace Gas Monitoring
- NASA GTE Missions
- City Studies
- Biomass Burning Studies
- Polar Studies
Global Trace Gas Monitoring
UCI global trace gas
monitoring sites.
In order to determine "background" concentrations of selected trace gases, we have been collecting ~80 air samples at ~45 remote surface locations in the Pacific basin (Alaska to New Zealand) every three months since 1978. More than 100 hydrocarbons and halocarbons – such as methane (CH4), ethane (C2H6), chlorofluorocarbons (CFCs) and tetrachloroethene (C2Cl4) – are routinely present in the remote air samples.
The UC-Irvine network is the world’s longest continuous record
of directly measured trace gases.
Our extensive halocarbon data set complements the ALE/AGAGE and NOAA/CMDL monitoring networks, and our network also includes a unique hydrocarbon data set that is continuous since the mid-1980s and has helped us understand the changes in methane’s growth rate during the past two decades.
Data Highlights: Methane (CH4)
Global CH4 mixing ratio and growth (1978-2006).
Methane has been second (to CO2) in climatic forcing from 1750 to 2000, but is monitored globally by few research groups. Our record begins in early 1978, at which time the global CH4 mixing ratio was 1515 ± 6 ppbv. In the past thirty years CH4 levels have increased by more than 15%, to 1776 ± 1 ppbv by 2006. However, methane’s growth began to slow in the late 1980s, and, unexpectedly, CH4 levels have remained basically unchanged for the past 8 years, from 1999-2006. This temporary pause in methane’s growth rate is dramatically different from the 1% per year increase of the 1980s. Because methane’s budget is so finely balanced, a small perturbation to any of its sources could push methane’s concentrations up or down from its present value. (Methane’s major sources include wetlands, rice paddies, ruminant animals, energy use, biomass burning and landfills.) Therefore there is no reason to believe that CH4 levels will necessarily remain steady in the future.
Comparison of global CH4 growth with global ethane and
C2Cl4 mixing ratios.
We also provide new insights into the causes of major CH4 fluctuations in recent years. Our complementary measurement of other compounds such as ethane and C2Cl4 confirms the biomass burning origin of large global CH4 pulses in 1998 and 2002-2003. Ethane has two major sources, fossil fuel and biomass burning, both of which are shared with CH4. By contrast, C2Cl4 is an industrial solvent that does not share sources with CH4 or ethane (whereas CH4, ethane and C2Cl4 all share the same sink, OH). Because the CH4 and ethane fluctuations track each other, whereas the C2Cl4 fluctuations do not match, the cause of the variations must be a source common to both CH4 and ethane. The timing of the peaks matches major global biomass burning activity in Indonesia in 1997, and in boreal regions in 1998 and 2002-2003. Further, the CH4 anomalies also track El Niño Southern Oscillation (ENSO) activity, which is consistent with additional hydrocarbon release from large-scale biomass burning triggered by drought conditions during El Niño years.
Selected Publications
I. J. Simpson, F. S. Rowland, S. Meinardi, and D. R.Blake,
Influence of biomass burning during recent fluctuations in the slow growth of tropospheric methane,
Geophys. Res. Lett., 33, L22808, 10.1029/2006GL027330, 2006.
I. J. Simpson, S. Meinardi, N. J. Blake, F. S. Rowland, and D. R. Blake,
Long-term decrease in the global atmospheric burden of tetrachloroethene (C2Cl4),
Geophys. Res. Lett., 10.1029/2003GL019351, 2004.
I. J. Simpson, D. R. Blake, F. S. Rowland, and T.-Y. Chen,
Implications of the recent fluctuations in the growth rate of tropospheric methane,
Geophys. Res. Lett. 29 (10), 672-675, 2002.
Continuing world-wide increase in tropospheric methane, 1978-1987,
Science, 239, 1129-1131, 1988.
D. R. Blake and F. S. Rowland,
Global atmospheric concentrations and source strengths of ethane,
Nature, 321, 231-233, 1986.
Pdf-format reprints are available in [Publications].
NASA GTE Missions and NSF Missions
Since 1988 our research group has been involved in more than a dozen NASA and NSF sponsored airborne projects [http://www.gte.larc.nasa.gov/]. The general motivation for these experiments is to better understand human impacts on the composition and chemistry of the global troposphere.
During NASA missions our group collects up to 168 whole air samples per flight aboard the NASA DC-8 research aircraft, and up to 144 samples per flight aboard the NASA P-3B.
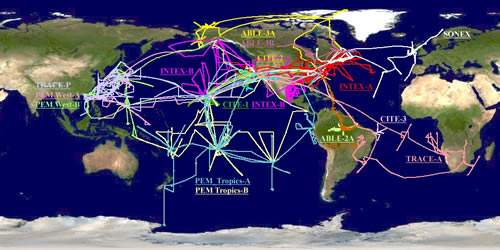
A Wide Global Coverage: NASA airborne tropospheric chemistry field campaigns,
1983-2006. http://www-gte.larc.nasa.gov/trop_map.htm
ARCTAS Mission (2008)
The 2008 Arctic Research of the Composition of the Troposphere from Aircraft and Satellites (ARCTAS) field mission seeks to better understand the Arctic troposphere and processes that impact climate and air quality .
During the spring and summer 2008 campaigns (deploying from Fairbanks and Edmonton, respectively) our measurements will be crucial to
- pinpointing the origin and “age” of the sampled air masses;
- estimating the contribution of hydrocarbons to springtime tropospheric O3 formation;
- determining the impact of boreal forest fires on Arctic tropospheric composition and chemistry; and
- better understanding halogen radical chemistry in the Arctic.
We will also address other outstanding questions in the study of Arctic pollution, including whether or not there has been a trend in certain constituents of Arctic haze; whether or not Southeast Asia makes a significant contribution to Arctic pollution; and whether insight can be gained into elevated CH3Br levels that have previously been observed during the Arctic spring.
Tropical Composition, Cloud and Climate Coupling: TC4 (2007)
The NASA Tropical Composition, Cloud and Climate Coupling (TC4) mission investigated convective processes in the eastern tropical Pacific in July 2007, based in Costa Rica.
High altitude aircraft collected tropopause data while medium altitude aircraft provided profiles and structure measurements of the tropical upper troposphere and lower stratosphere. Our group’s measurements of established tracers of tropical convection (CH3I, DMS, and MeONO2, each with different atmospheric lifetimes), together with our comprehensive array of other tracers, was critical for interpreting the relationship between observations of upper tropospheric humidity and convection. Our tracers were used to determine the history of the various air parcels sampled from different regions of tropical cloud systems, and they provided vital clues to the origin of layers of high relative humidity and cirrus layers that are often observed in the upper troposphere. In addition to being critical for the correct interpretation of tropical convection, they were used to study chemical, dynamical and physical processes occurring in the tropical upper troposphere and in the layer surrounding the tropical tropopause.
Missions at a Glance: INTEX-NA - INTEX-B, MILAGRO(2004, 2006)
The Intercontinental Chemical Transport Experiment-NA (INTEX-NA) was a two phase experiment aimed at understanding the transport and transformation of gases and aerosols on transcontinental/intercontinental scales and assessing their impact on air quality and climate. The first mission, INTEX-A, took place during the summer of 2004 with bases in Illinois and New Hampshire. The second mission, INTEX-B, flew during spring 2006.
Other Previous Missions:
TRACE-P (2001)
TOPSE (2000)
BIBLE-B (2000)
PEM-Tropics B (1999)
SONEX (1997)
PEM-Tropics A (1996)
ABLE
ACE
AASE
PEM-WEST
CITE
Pdf-format reprints of representative publications can be found in [Publications].
City Studies
Our group discovered the impact of liquefied petroleum gas (LPG) leakage on the air quality in Mexico City and other cities, and we pioneered the urban grid sampling technique during a 2001 study of Santiago, Chile. We have performed air quality analysis in more than 50 cities worldwide.
Chinese city studies
An urban air sampling campaign was conducted in China in January/February 2001 in order to characterize the distribution of urban VOCs and to identify their likely sources. Forty-three cities – covering 15 of 23 provinces, 2 of 5 autonomous regions, and 3 of 4 municipalities – were studied. This is the most comprehensive study of its kind.

Bridge over the Pearl River, China.
Halocarbons.
China is the largest producer of halogenated compounds that are restricted under the Montreal protocol and subsequent amendments. During this study chlorofluorocarbons (CFCs), hydrochloroflurocarbons (HCFCs), hydrofluorocarbons (HFCs), halons, and other chlorinated compounds were measured. Most of these compounds were enhanced compared to background levels. However, the enhancement of CFCs was smaller than expected, with CFC-12 and CFC-11 enhancements of 5% and 9% with respect to the global background. By contrast, CFC replacements and halogenated compounds used as solvents were strongly enhanced. The average Halon-1211 concentration exceeded the background of 4.3 pptv by 75% and was higher than 10 pptv in some cities. Methyl chloride (CH3Cl) mixing ratios were also high, which is likely related to the widespread use of coal and biofuel in China.
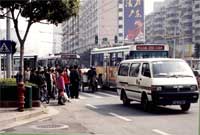
Traffic in the Pearl River Delta city of Dongguan, China.
Hydrocarbons.
In order to identify the main sources of hydrocarbons in Chinese cities, cross-correlations with the general combustion tracer ethyne and the gasoline marker i-pentane were investigated. Most of the identified NMHCs correlated with ethyne or i-pentane, suggesting a strong contribution of combustion and gasoline evaporation. To differentiate between vehicular and other combustion sources, the characteristic benzene-to-toluene (B/T) ratio for the Chinese vehicular fleet was calculated using roadside samples (collected in 25 cities). Using a B/T ratio of 0.6 ± 0.2, two groups of cities were identified: 10 cities with a ratio of 0.4-0.8, and 15 cities with a ratio >1. In the former group, the relatively low B/T ratio and good correlations with i-pentane suggests that vehicular emissions (vehicular combustion + gasoline evaporation) were the main source of identified hydrocarbons. In the latter group, the high B/T ratio combined with various correlation slopes indicates that although combustion is still the main VOC source, it likely derives from coal and/or biofuel usage. Natural gas leakage, or some other methane/ethane source, also appears to impact NMHC concentrations in this latter group. As we have previously observed in Karachi, vehicular emissions were found to be an important source of isoprene in some cities, and combustion may account for about half of the winter isoprene observed in the 43 Chinese cities.
Karachi study
In the winter of 1998-1999 we collected a total of 78 samples at six urban sampling sites throughout Karachi. The samples were analyzed for 72 species including non-methane hydrocarbons, halocarbons and alkyl nitrates. This is the first time that VOC levels have been extensively characterized in the urban environment in Pakistan.
Methane (CH4, 6.3 ppmv) and ethane (C2H6, 93 ppbv) levels in Karachi were much higher than in other cities that have been studied. The very high CH4 levels highlight the importance of natural gas leakage in Karachi. LPG leakage contributes to elevated propane and butane levels in Karachi, although their burdens were lower than in other cities (e.g. Mexico City, Santiago). High benzene levels (0.3-19 ppbv) also appear to be of concern in Karachi.
Vehicular emissions were characterized using air samples collected along the busiest thoroughfare of the city (M.A. Jinnah Road). Vehicular exhaust emissions were the main source of many of the reported hydrocarbons. Interestingly, significant levels of isoprene (1.2 ppbv) were detected at the roadside, and we estimate that vehicular exhaust accounts for about 20% of the isoprene observed in Karachi. 1,2-Dichloroethane, a lead scavenger added to leaded fuel, was also emitted by the vehicular fleet. The photochemical production of ozone (O3) was calculated for CO and the various VOCs using the Maximum Incremental Reactivity (MIR) scale. Based on the MIR scale, the main contributors to O3 production in Karachi are ethene, CO, propene, m-xylene and toluene.
Santiago study

Former UCI team member, Jimmie Lopez, taking air samples in Santiago, Chile, 1999.
Liquefied petroleum gas (LPG).
Santiago is one of the most polluted cities in South America. To reduce the ambient O3 levels in Santiago, the local air quality commission recommended that nitrogen oxide (NOx) and nonmethane hydrocarbon (NMHC) emissions be halved from 1997 levels by the year 2011. Vehicles and industry have been cited as the most important air pollution sources, and programs are in place to reduce industrial and vehicular pollutant emissions. However, our investigation found that a major fraction of the NMHCs in Santiago’s air result instead from the emissions of LPG, which is used extensively throughout Santiago for domestic cooking and heating. Our research showed that roughly 5% of the LPG that is sold in Santiago leaks into the atmosphere, and that the leakage is responsible for about 15% of the locally produced O3 in Santiago. In order for the NMHC reductions to be successful, the impact of LPG leakage on Santiago’s air quality must be recognized.
Methyl bromide (CH3Br). Our group estimated vehicular CH3Br emissions based on 88 whole air samples collected in a grid pattern throughout Santiago in June, 1996. Half the samples were collected at 5 a.m. during minimal vehicular activity, and half at the same locations at 9 a.m. during the morning rush hour. A comparison of the two grid results represents the effects of meteorology, chemistry, and emissions. In Santiago, CH3Br emissions are associated with vehicular exhaust, but also have a significant and apparently continuously emitting unidentified source. The city-wide CH3Br to CO volume emission ratio for Santiago is 2.2 × 10⁻⁶, and ~8.0 × 10⁻⁶ kg of CH3Br is released per liter of leaded gasoline. Assuming the Santiago results apply to other cities still using leaded gasoline, a global vehicular CH3Br emission of 4 ± 3 Gg yr-1 is estimated. This small vehicular CH3Br emission source strength will not improve the current CH3Br budget imbalance.
Mexico City study
Alkane hydrocarbons (propane, i-butane, and n-butane) from liquefied petroleum gas (LPG) are present in major quantities throughout Mexico City air because of leakage of the unburned gas from numerous urban sources. These hydrocarbons, together with minor olefinic LPG components, furnish substantial amounts of hydroxyl radical (OH) reactivity, a major precursor to formation of the ozone (O3) component of urban smog. The combined processes of unburned leakage and incomplete combustion of LPG play a significant role in causing the excessive ozone characteristic of Mexico City. Since our study was published, reductions in O3 levels in Mexico City have been possible through changes in LPG composition and lowered rates of leakage.
Selected Publications
B. Barletta, S. Meinardi, I. J. Simpson, F. S. Rowland, C. Y. Chan, X. M. Wang, S. C. Zhou, L. Y. Chan, and D. R. Blake,
Ambient halocarbon mixing ratios in 45 Chinese cities,
Atmos. Environ., 40, 7706-7719, 2006.
B. Barletta, S. Meinardi, F. S. Rowland, C.-Y. Chan, X. Wang, S. Zou, L. Y. Chan and D. R. Blake,
Volatile organic compounds in 43 Chinese cities,
Atmos. Environ., 39 (32), 5979-5990, 2005.
B. Barletta, B., S. Meinardi, I. J. Simpson, H. A. Khwaja, D. R. Blake, and F. S. Rowland,
Mixing ratios of volatile organic compounds (VOCs) in the atmosphere of Karachi, Pakistan,
Atmos. Environ. 36 (21), 3429-3443, 2002.
T.-Y. Chen, I. J. Simpson, D. R. Blake, and F. S. Rowland,
Impact of the leakage of liquefied petroleum gas (LPG) on Santiago air quality,
Geophys. Res. Lett. 28, 2193-2196, 2001.
T.-Y. Chen, D. R. Blake, J. P. Lopez, and F. S. Rowland,
Estimation of global vehicular methyl bromide emissions: Extrapolation from a case study in Santiago, Chile,
Geophys. Res. Lett., 26, 3, 283-286, 1999.
D. R. Blake and F. S. Rowland,
Urban leakage of liquefied petroleum gas and its impacts on Mexico City air quality,
Science, 269, 953-956, 1995.
Pdf-format reprints are available in [Publications].
Biomass Burning Studies
Biomass burning is not a source of methyl chloroform (CH3CCl3)
Decline in global Methyl Chloroform mixing ratios.
An advantage of a multi-year, globally comprehensive data set – such as the one our group has accumulated during more than two decades of airborne and ground-based sampling – is the ability to return to older data sets in order to solve outstanding questions in the literature.
For example, declining industrial methyl chloroform (CH3CCl3) emissions and their reliability in estimating global hydroxyl radical (OH) trends is a topic of recent active debate in the literature.
We have recently addressed a further uncertainty for the first time: the possible biomass burning source of CH3CCl3, whose reported magnitude (2-10 Gg yr-1) is currently approaching that of the declining anthropogenic component (~20 Gg yr-1 and falling). However, the estimated biomass burning source of CH3CCl3 was based on a single small study. We employed thousands of measurements collected from the
world’s major biomass burning ecosystems during the past 15 years to show that biomass burning emissions of CH3CCl3 based on this previous study have been greatly overestimated, and are unlikely to exceed 0.014 Gg CH3CCl3 yr-1.
In addition to correctly constraining the global CH3CCl3 budget, removing the uncertainty regarding the magnitude of the global CH3CCl3 biomass burning source may extend methyl chloroform’s period of usefulness for determining global levels and trends of OH, the most important reactive species in the atmosphere.
Mixing ratio of Methyl Chloroform did not change, even in a plume.
I. J. Simpson, N. J. Blake, D. R. Blake, S Meinardi, M. P. Sulbaek Andersen, and F. S. Rowland,
Strong evidence for negligible methyl chloroform (CH3CCl3) emissions from biomass burning,
Geophys. Res. Lett., 34, L10805, doi:10.1029/2007GL029383, 2007.
Record high mixing ratios during Australian savanna burning study
The most highly concentrated biomass burning samples that our group has ever measured were collected at ground-level extremely close to active fires (within 3 m) in the Australian savanna (Sept. 1999). The mixing ratios of many gases were several orders of magnitude higher than background levels, and in many cases were easily the highest we have ever detected. These exceptionally high mixing ratios have led to many interesting discoveries.
Emissions of DMDS and DMS.
Savanna biomass burning is a major localized source of dimethyl disulfide (DMDS) and dimethyl sulfide (DMS). During the Australian savanna burning study we measured record-high mixing ratios of both DMDS (113,000 pptv) and DMS (135,000 pptv), compared to background mixing ratios that were below the detection limit (10 pptv). The average DMDS and DMS mixing ratios in fires plumes in Northern Australia are by far the highest ever reported in the troposphere. This study also represents the first emission estimate of DMDS reported from biomass burning, and we identified DMDS as the major reduced sulfur-containing gas emitted from bushfires in Australia’s Northern Territory. Assuming our observations are representative of biomass burning, we estimated that biomass burning could yield up to 175 Gg yr-1 DMDS (119 Gg S yr-1) and 13 Gg yr-1 of DMS. In addition, we discovered that DMDS is emitted during both the flaming and smoldering stages of the fire, whereas DMS and carbonyl sulfide (OCS) are mainly emitted during the smoldering stage. Although DMS emission from biomass burning has a small impact on the total budget of DMS worldwide, together DMS, DMDS and OCS are estimated to account for a further 10% of the atmospheric sulfur emitted by biomass burning. The emissions of DMDS and DMS appear to be largely confined to the boundary layer, and their rapid oxidation to SO2 may be an important path for returning organic sulfur to the biosphere.
S. Meinardi, I. J. Simpson, N. J. Blake, D. R. Blake, and F. S. Rowland,
Dimethyl disulfide (DMDS) and dimethyl sulfide (DMS) emissions from biomass burning in Australia,
Geophys. Res. Lett. 10.1029/2003GL016967, 2003.
Biomass burning emissions sampling in Australia.
Emissions of alkyl nitrates.
Based on the Australian study we have reported the first observations of the emission of five C1-C4 alkyl nitrates (methyl-, ethyl-, n-propyl-, i-propyl-, and 2-butyl nitrate) from savanna burning. Average alkyl nitrate mixing ratios in the immediate vicinity of three bushfires in Northern Australia were 47-122 times higher than local background mixing ratios. As was the case for DMDS and DMS, these are the highest alkyl nitrate mixing ratios we have ever detected. The maximum methyl nitrate mixing ratio (3,300) was 3-4 orders of magnitude higher than typical background values. Methyl nitrate dominated the alkyl nitrate emissions during the flaming stage of savanna burning, whereas C2-C4 alkyl nitrates were mostly emitted during the smoldering stage. To explain the formation of alkyl nitrates from biomass burning, we have proposed a reaction mechanism involving the combination of reactive radicals at high temperature. Bearing in mind the uncertainties associated with extrapolating small data sets to much larger scales, we estimated that alkyl nitrate emissions from global savanna burning are on the order of 8 Gg yr-1.
I. J. Simpson, S. Meinardi, D. R. Blake, N. J. Blake, F. S. Rowland, E. Atlas, and F. Flocke,
A biomass burning source of C1-C4 alkyl nitrates,
Geophys. Res. Lett. 29 (24), 2168, 10.1029/2002GL016290, 2002.
Emissions of methyl chloroform.
As described above, the highly concentrated Australian savanna burning samples led to record-high mixing ratios and the discoveries that DMDS and alkyl nitrates are emitted from biomass burning. Therefore, if CH3CCl3 were emitted from biomass burning, these would be the ideal samples in which to detect it. Instead, even though the biomass burning tracer methyl chloride (CH3Cl) ranged over 3 orders of magnitude, CH3CCl3 mixing ratios were not elevated. Even in the sample with the highest levels of DMDS (113,000 pptv) and CO (2,780,000 ppbv) – which were 11,000 and 27,000 times the local background levels, respectively – CH3CCl3 remained at its background value of 60 pptv. These tightly constrained observations were a key component of our conclusion that CH3CCl3 is not released from biomass burning.
I. J. Simpson, N. J. Blake, D. R. Blake, S Meinardi, M. P. Sulbaek Andersen, and F. S. Rowland,
Strong evidence for negligible methyl chloroform (CH3CCl3) emissions from biomass burning,
Geophys. Res. Lett., 34, L10805, doi:10.1029/2007GL029383, 2007.
Pdf-format reprints are available in [Publications].
Polar Studies
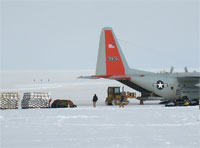
C-130 unloading at Summit,
Greenland, 2007.
Our polar research has focused on trace gas analysis of hydrocarbons, halocarbons, and alkyl nitrates from measurements taken at the South Pole and Summit, Greenland. We have examined how the mixing ratios of these trace atmospheric gases in remote polar locations are dependent on pathways of photochemical loss and production, and thus follow distinct seasonal trends.
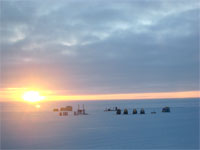
Midnight sun at the Research
Camp at Summit, Greenland, 2007.
From our firn measurements we were able to demonstrate that significant levels of hydroxyl radical are present below the surface of the snow, indicating that this region has active photochemistry.
Our lab has been participating in field campaigns at Summit, Greenland, since 1997. This remote field station is located at approximately 11,000 ft. elevation on the Greenland ice sheet. Our field measurements during these campaigns have include both ambient, firn, and chamber studies, in an effort to characterize hydrocarbons, halocarbons, and alkyl nitrates. The focus of the 2007 and 2008 field campaigns has been to investigate the presence and influence of halogen chemistry during the spring and summer months.
Read the 2008 Greenland Research Blog:
[http://greenland-2008.blogspot.com/]
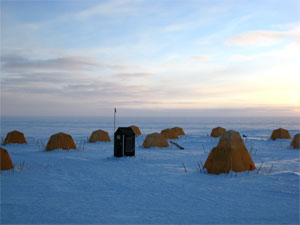
Tent City at Summit, Greenland, 2008.
Selected Publications
A. J. Beyersdorf, N. J. Blake, A. L. Swanson, S. Meinardi, J. E. Dibb, S. Sjostedt, G. Huey, B. Lefer, F. S. Rowland, and D. R. Blake,
Hydroxyl concentration estimates in the sunlit snowpack at Summit, Greenland,
Atmospheric Environment, 41, 5101-5109, 2007.
A. L. Swanson, N. J. Blake, E. Atlas, F. Flocke, D. R. Blake, and F. S. Rowland,
Seasonal variations of C2-C4 nonmethane hydrocarbons and C1-C2 alkyl nitrates at Summit Research Station in Greenland,
Journal of Geophysical Research, 108, 4065, 2003.
A. L. Swanson, N. J. Blake, J. E. Dibb, M. R. Albert, D. R. Blake, and F. S. Rowland,
Photochemically induced production of CH3Br, CH3I, C2H5I, ethene, and propene within surface snow at Summit Greenland,
Atmospheric Environment, 36 (15-16), 2671-2682, 2002.
Pdf-format reprints are available in [Publications].